Monday, August 18, 2014

Processor Performance Counter

CPU and Memory utilization are key metrics captured in any performance test. This post will be focusing on CPU utilization and dealing with CPU bottleneck.

Whenever we say CPU utilization for a CPU with configuration 4 GHZ with 1 core is 80% this mean that currently 3.2 billion cycles in a seconds. However this calculation is not that easy in normal case considering when we have multi cores, hyperthreading, virtualization, shared cache and other advancement going in infrastructure space.

For any loadtest run, following performance counters should be typically used

- % Processor Time_Total Instance - Percentage of elapsed time a CPU is busy executing a non-idle thread (An indicator or processor activity). 85% of processor utilization can be taken as a threshold value.

Normally, CPU utilization should increase as load is increased. If CPU utilization is not increased then we may have a bottleneck which will impact the throughout and response time. Underutilization normally happens when we have multiprocessor systems with one JVM. To take the advantages of most of the processing power we might like to consider more than one JVM


Sometimes, load test will show us spike/burst in CPU utilization. Understanding the reason behind burst will require additional metrics and counters.

- Processor\% User Time : This counter will helps us in identifying any high user mode processor bottleneck.

- % Privilege Time-Percent of threads running in privileged mode (file or network I/O, or allocate memory)

Processor % Privilege Time consistently over 75 percent indicates a bottleneck.

Processor Queue Length - Number of tasks ready to run than the processors can get to.
Processor Queue Length greater than 2 indicates a bottleneck. It would be good to check with the Dev/infra team about the value of thread pool and should it be increased or not.


System\Context Switches /sec. Occurs when higher priority threads preempts lower priority threads that are currently running, and can indicate when too many threads are competing for processor time. If much processor utilization is not seen and very low levels of context switching are seen, it could indicate that threads are blocked

As a general rule, context switching rates of less than 5,000 per second per processor are not worth worrying about. If context switching rates exceed 15,000 per second per processor, then there is a constraint.


Monday, August 11, 2014

Powershell for Performance counters

APM tools and perfmon are great tools to monitor the system resources utilization. We can also use simple PowerShell scripts to monitor resources utilization and much more. Needless to say all the windows server products comes with inbuilt PowerShell.

Below is the simple PowerShell script which can be used to monitor CPU and memory utilization by a particular process


1:  $loop_count = 3   
2:  $cpu_threshold = 85   
3:  $memory_threshold = 90   
4:  $sleep_interval = 5   
5:  $hitcpu = 0   
6:  $hitmemory = 0   
7:  $target="firefox"   
8:  foreach($turn in 1..$loop_count)   
9:  {   
10:   $cpu = (gwmi -class Win32_Processor).LoadPercentage   
11:   $process = Get-Process | Where-Object {$_.ProcessName -eq $target}   
12:   $memory=[Math]::Round($process.privatememorysize/1mb, 2)    
13:   Add-content c:\users\amah11\Desktop\logs.txt "CPU utilization is Currently at $cpu%'"   
14:   Add-content c:\users\amah11\Desktop\logs.txt "Memory utilized by $target is $memory"   
15:   If($cpu -ge $cpu_threshold )   
16:   {   
17:      $hitcpu = $hitcpu+1   
18:   }   
19:   If($memory -ge $memory_threshold )   
20:   {   
21:      $hitmemory = $hitmemory + 1   
22:   }   
23:   start-sleep $sleep_interval    
24:   if($hit -eq 3)    
25:   {   
26:   Write-Host "CPU utilization above $cpu_threshold" -foregroundcolor red -backgroundcolor yellow   
27:   }   
28:   if($hitmemory -eq 3)    
29:   {   
30:   Write-Host "Memory utilization above $memory_threshold" -foregroundcolor red -backgroundcolor yellow   
31:   }   
32:  }   
In this script we are storing the result in a log file and checking if any counter is going above the threshold value. Based on occurrence of threshold violation we are echoing a warning message.

Through PowerShell we have to all the performance counters available. Also, for capturing memory utilization for a process which is not running before start of test we would have to capture all instances of process and then filter out result which can be avoided in case we use ps script.

Wednesday, August 6, 2014

Virtual Vuser Vs Real Users.


We all know in performance testing we have Vusers concepts but do Vuser and Real Users are same and do we have a one to one relationship between real and virtual users always. No that’s not the case. It depends on what is being tested and how we have script/design the scenario. We can design the scenario in such a way so that we can represent multiple real users by single vuser.

To determine the ratio, we need to have a good understanding of Performance goal and Application usage pattern. Little law's can be used to estimate number of vusers

Little law is represented by below formula
L= λW

Where W=Average Response Time + Think Time and λ is the arrival rate.

So, considering there is an eCommerce application where user arrives at the rate of 10 users per seconds and we have target average response time is 5 Seconds. In this case number of vusers we would be simulating is 10*3=50

Above concepts helps in designs  scenario where we have a Vuser # restriction for tool license. Using the above approach we can simulate the load for higher number of user by manipulating the think time.


Load generator capacity calculation


Resources requirement for a load test infrastructure vary from applications to applications due to the technology stack being used and complexity of scenarios and scripts Saying my load generator would support x number of users is a very risky statement unless we have done some analysis and math to prove the statement. Following steps are suggested by HP to figure out the load generator capacity with respect to the protocol and test script

  1. Run the single user test using controller. Keep a delay of few minutes in starting the script. Once script executions starts, observe the decrease in memory. Amount of memory decreased is our "First Vuser Memory"
  2. Modify the test to run for 5-10 Vuser. Keep a delay of few minutes in starting the script and for each vuser. Notice the decrease in memory when each new user ramp up. This decrease in memory is our "Each Additional Vuser memory"
  3. Now, for getting the Load generator capacity
  4. Find out the total RAM available on the load generator. This will be "Total RAM"
  5. Subtract 700-750 MB RAM for OS activities
  6. Find out what is the 75% of the remaining RAM
  7. Subtract "First Vuser Memory" from the remaining RAM in step 5
  8. Divide the figure by "Each Additional Vuser memory+1" to get number of vuser supported by LG


So, we can have following formula to arrive at load generator capacity based on RAM

((Total LG RAM - ~750 MB) - First Vuser Memory)/(Each Additional Vuser memory + 1)

This formula will provide the good result for all protocols except protocols involving GUI interactions like citrix, truclient, RDP as these protocols have GDI interactions which is not taken into account in above calculations

Above steps can be tweaked for getting result based on other system resources as well.

The result obtained by the above can be treated as a conservative figure but it is good to play safe when you don't want to affect your test due to test infrastructure


Wednesday, July 9, 2014

Heap management in JAVA

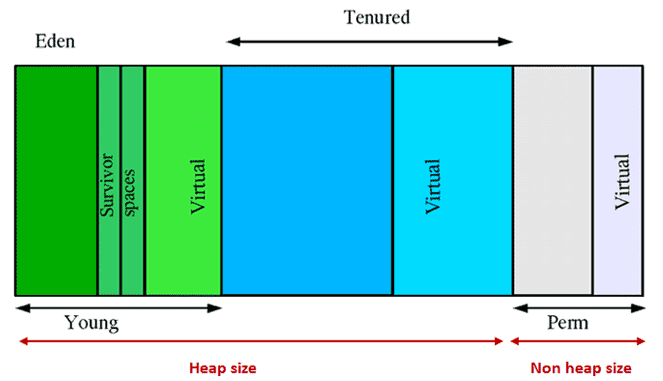
Heap is the important concept for analyzing performance of Java application and to understand the details of Heap we need to understand how JVM uses the system memory. In JVM memory can be divided into following categories

  • -          Heap memory
  • -          Non Heap memory
  • -          Other (JVM code, internal structure etc.)
The Java heap space is the run time data area from which the JVM allocates memory for all of the Java application's objects and arrays. So when we create any object in JAVA we are basically creating that object in the heap area. From the performance testing point of view Java heap space is the most frequently tuned feature of a JVM, and is configured with the -Xms -Xmx command line options. 
One of the important points to remember here is maximum heap size we can define for 32 bit OS is 4 GB while that for 64 GB is 32 GB.
Non Heap memory stores per class structures like runtime constant pool, field and method data, and the code for methods and constructors, as well as interned Strings.
Unfortunately, the only information JVM provides on non-heap memory is its overall size. No detailed information on non-heap memory content is available.
Coming back to Heap memory, we can consider Heap to be divided into two categories:
-          Eden and tenured.
Initially all objects gets created in Eden space. Once GC is called objects which are not required or referenced any more gets deleted and still referenced objects are move to survivor area with in Eden space and objects which survive the GC on survivor area are moved to tenured area. We have this division to have better memory management and performance.  As there are various objects with different life cycle – Some objects remain live throughout the application while some objects die very soon. That is the reason we system provide different categories inside heap. Performing a GC on tenured area is more expensive then the Eden area.


Sizing the heap memory is a critical decision which should be taken based on the application. If we sized the heap memory to be large then during GC application may become unresponsive as JVM would be busy in doing the GC on large amount of memory also if we specify Heap to be less, throughput could be impacted due to increases in call for GC and can lead to “Out of memory exceptions”


Monday, July 7, 2014

Dynamic parameterization

Problem is to get dynamic proxy name and details (username,password) based on the different load generator machine. These machines could be in different zones with having different proxy servers.

Following code helps in getting the proxy details based on the current machine. Same solution can be used when we have to pick the substitution from the parameter list based on any condition. One example could be a search term. Say for Example I have n number of search term some search terms are invalid. Our requirement could be if a search term is invalid run the search query for same user with different search term.


int i, result;
char *current_host;
current_host = lr_get_host_name();
lr_output_message("The Actual Host is %s", current_host);
//Run the loop based on the number hosts you have in the parameter list
for(i=0;i<=20;i++)
{
lr_output_message("Current Host being verified is %s"lr_eval_string("{Host_Name}"));


if(strcmp(current_host,lr_eval_string("{Host_Name}"))==0)
{
lr_output_message("Setting the Username (%s), Password (%s) & Domain Name (%s) related to Host Name (%s)"lr_eval_string("{User_Name}"),lr_eval_string("{Password}"), lr_eval_string("{Domain}"), lr_eval_string("{Host_Name}"));
web_set_user("{User_Name}""{Password}""{Domain}");
break;
}
else
{
lr_output_message("Current Host evaluated is (%s) not matching with actual host"lr_eval_string("{Host_Name}"));
lr_advance_param("Host_Name");
}

Friday, July 4, 2014

Replay Engine in LoadRunner


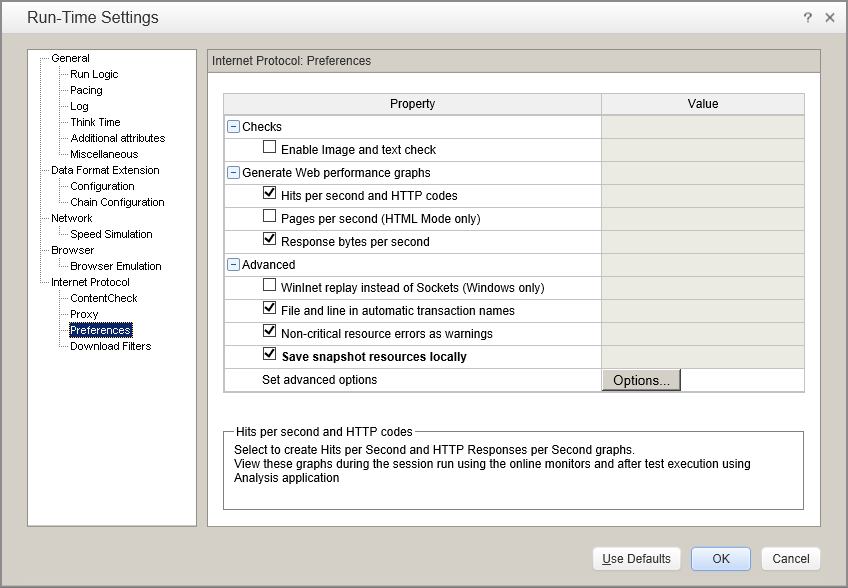
Loadrunner have support for Socket and Winlnet replay engines for replaying the script. We can control this setting from Replay>Run Time Settings.


In above screenshot we can see there is an option to change replay choice between Sockets and WinInet. By default Loadrunner use the socket options and we should also use Socket only unless we WinInet is the only choice.
Socket is a scalable approach which used Loadrunner proprietary interface to communicate with the network whereas WinInet uses WinInet API which is used by Internet Explorer to communicate with the network. WinInet helps in resolving issues with the playback but it is not recommended for running the load test as it comes with the limitation of scalability.
Switching to winInet option is a good step to troubleshoot the replay errors.